Between sets
Why I built Session
How Session came about – a surfer with a spreadsheet habit who wanted an app that actually helped him spot the patterns.
How Session came about
If you know me, you know I like two things: surfing and spreadsheets.
More than one of the speeches at my wedding mentioned my spreadsheets. I'm still not sure what to make of that…
So naturally, I have a spreadsheet for many things, including recording my surf sessions.
Why I spreadsheet things
The thing about surfing is that you remember the feeling but not the details.
You paddle in after a session that just clicked – fun rides, good turns, the tide was just right, the board you grabbed turned out to be the call. You think, I should remember this. Three weeks later, you're trying to choose between two boards and a few spots on a Saturday morning, and you have no idea which version of those waves you'd actually want to repeat.
I wanted to find the patterns: which spots work on a NW swell; which board to take when it's low or high tide; when it's worth setting an alarm and when it's not. The kind of stuff every surfer half-knows after a few years and would actually know if they'd written any of it down.
So I started writing it down.
The spreadsheet years
What started as five columns turned into something a little more involved.
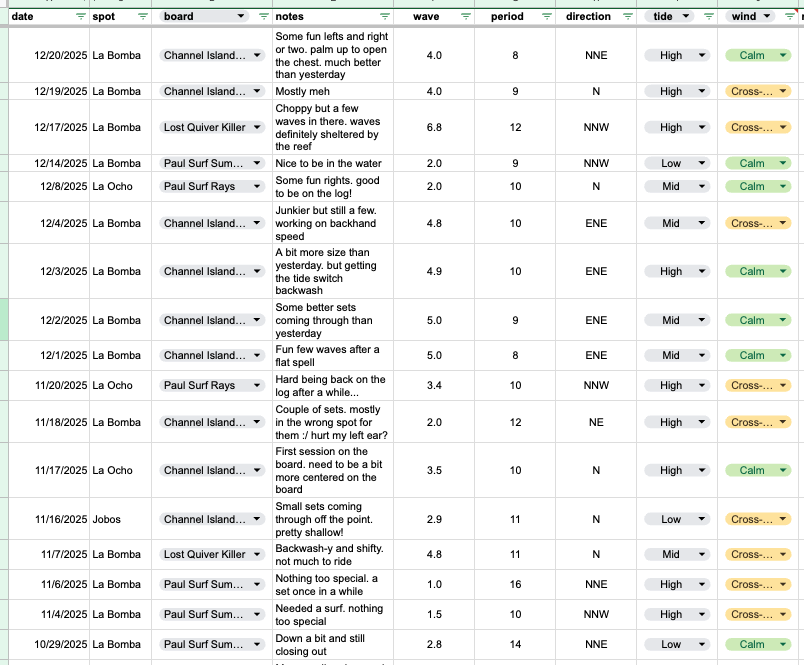
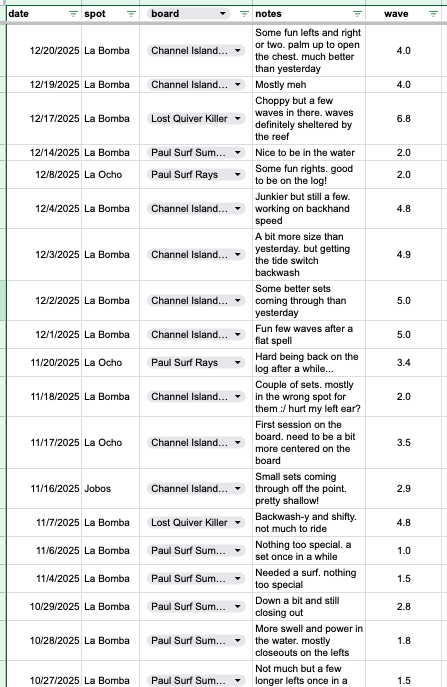
By year four, I had columns for surf spot, date, board, fins, swell height, swell period, swell direction, wind direction, tide level, etc., and a notes column with entries like "weird side-current after 8 a.m. lots of paddling…" and "the midlength was the wrong move, should've ridden the log."
I had pivot tables. I had conditional formatting. I had graphs of the number of sessions by month and year. I had a tab called "patterns I think I've noticed" that was basically my own private "forecast" model. All of this made me a lot more confident reading forecasts and knowing which spot would be working and which board(s) to bring. The spot out front needs some east in it and a low tide to be any good. The spot 10 minutes away does better on a low tide, but is really fun at high tide on 5ft+ 10s+ swell.
I caught a lot more good days because I'd taken notes.
As fun as spreadsheets are (for me), they can be a chore to use, especially on a phone. Finding the buoy data, copy-and-pasting it into the right cell – annoying to say the least.
Why nothing that already existed fit
Surely something like this exists, I thought. I went looking for the app version of my spreadsheet and tried a few. None of them felt like an app I'd actually use. They weren't bad apps, they just didn't offer the level of design or care I wanted. They weren't built for how I think about tracking conditions and gear, and I wanted something I'd actually look forward to using.
In a moment of pure genius coupled with the hubris of having Claude Code at my fingertips, I thought: I'll build it. An aesthetic, easy-to-use app with all my data in one place.
What Session is
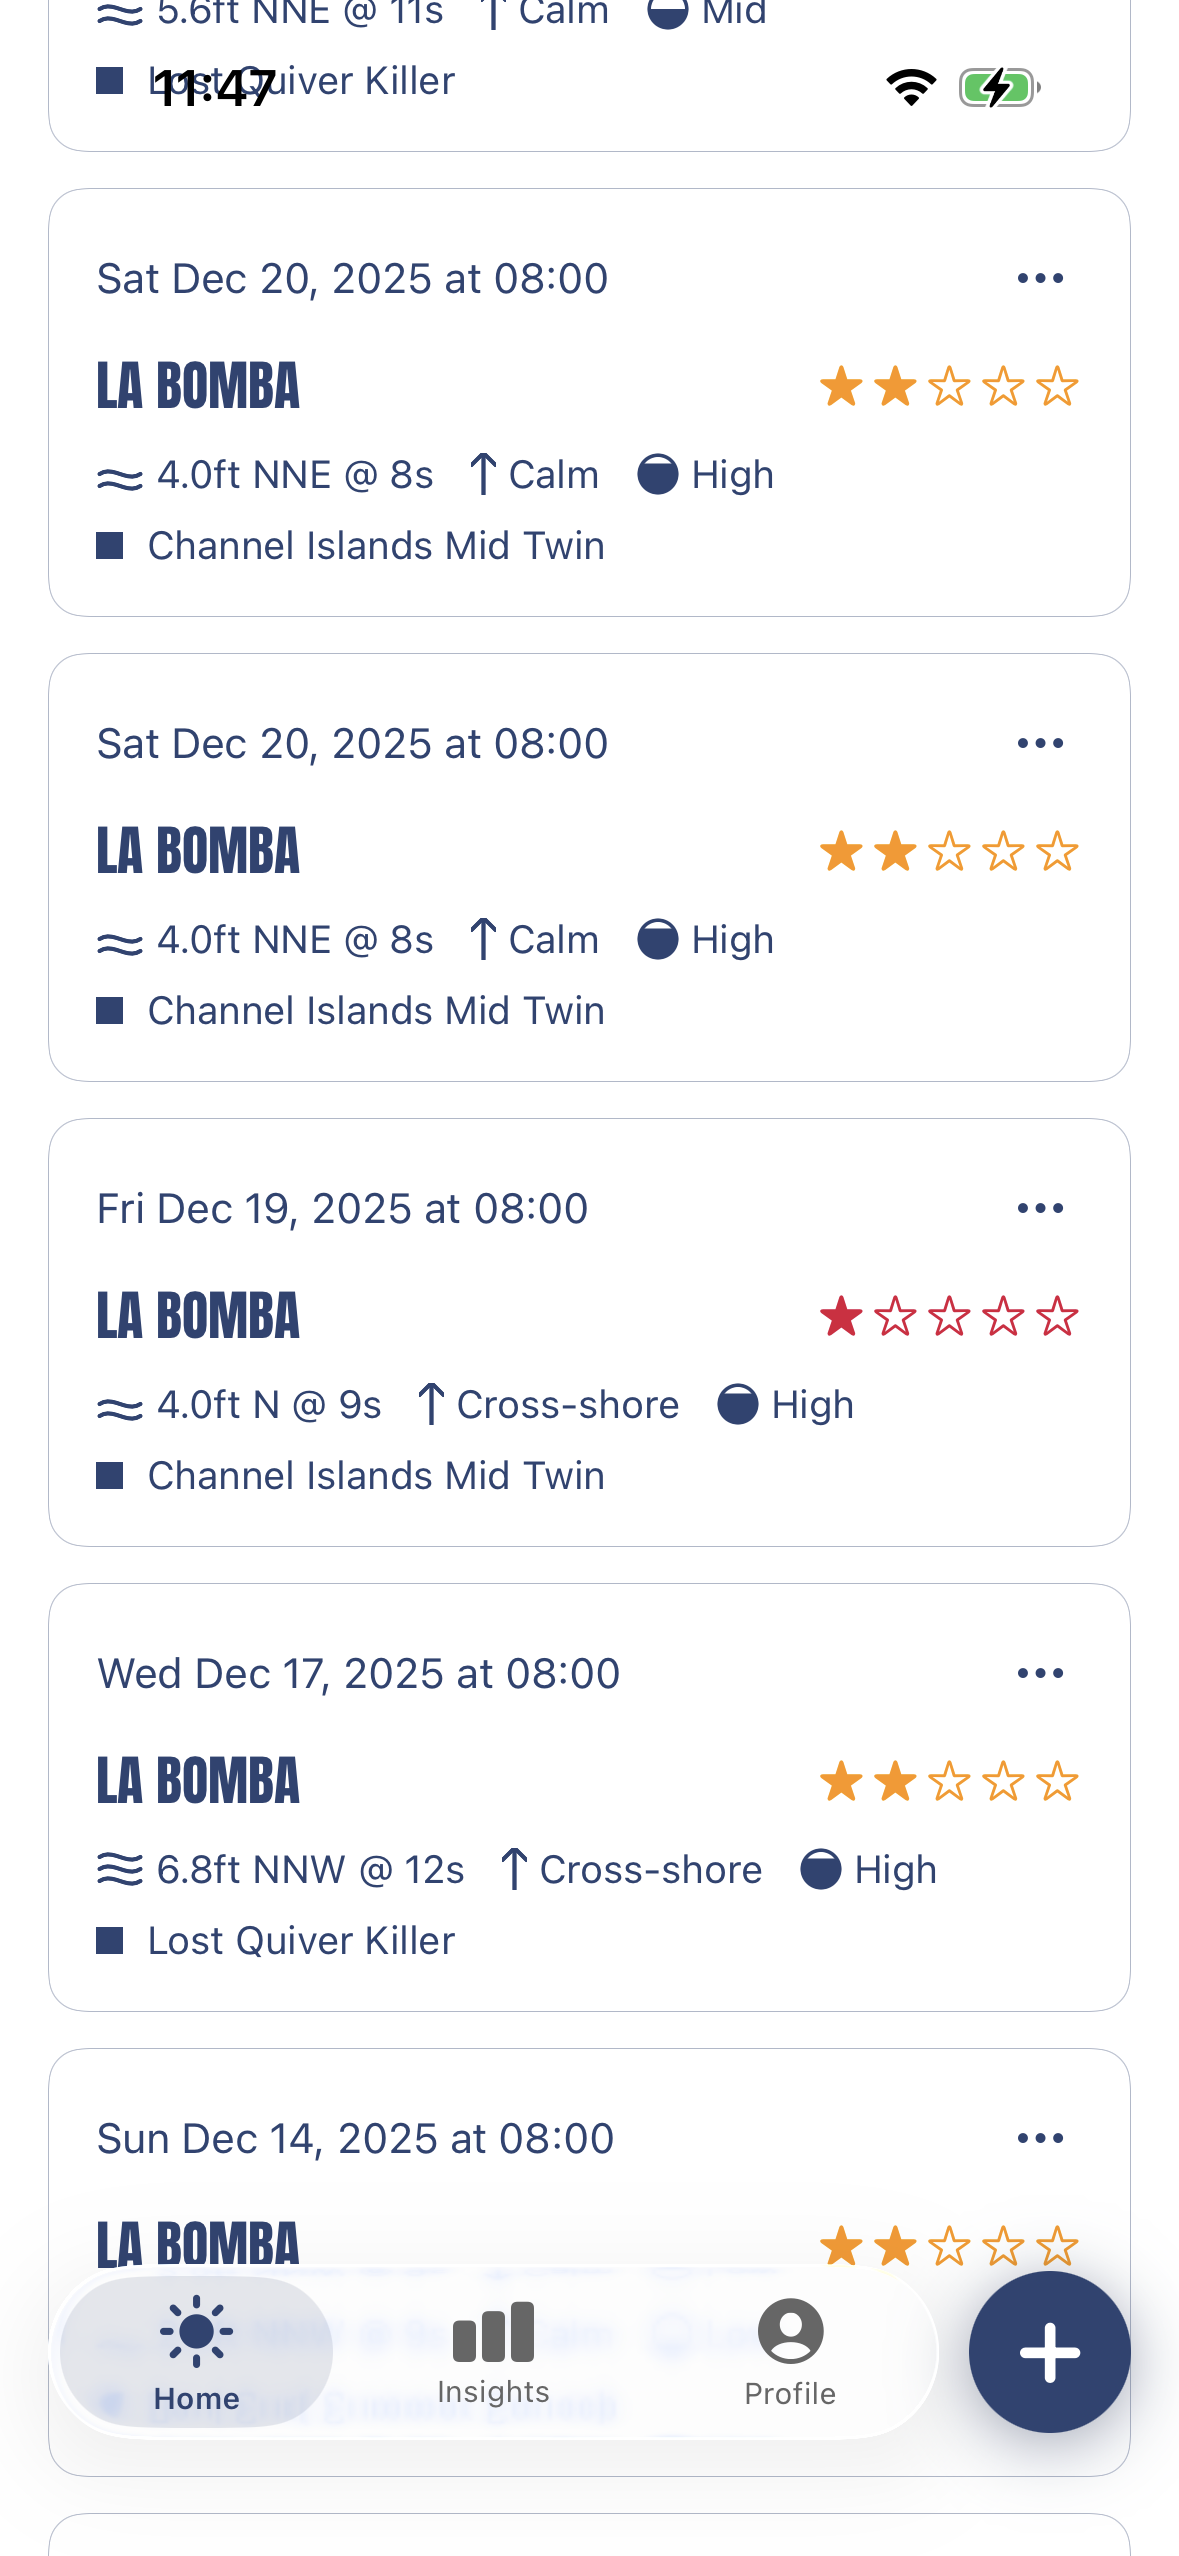
Session is the surf log I want to use after a session. Tap your spot. Tap your board. Tap a star rating. The conditions fill themselves in – wave height, swell period, wind, tide – pulled from the closest buoy and weather provider for the time and place where you surfed. The whole thing takes about 30 seconds.
Session tracks your quiver: every board, fin setup, and wetsuit you own. Tag what you rode each session, and, after a few weeks, you'll start to know which board actually works in which conditions – the same things I learned using my spreadsheet, but without the buoy-data scavenger hunt.
You can also tag the people you paddled out with – they'll get a notification, and if they're already on Session, they can log the same session with one tap. There's a weekly streak, because logging consistently is the only way the data pays off. There are insights about your spots, your boards, your conditions, because that's the whole point.
It's the upgraded version of my spreadsheet that I used after each session – 153 sessions and counting, to be precise.
How to try it
If you've been keeping a log – or you've been meaning to – Session might just help you take your next session to the next level, too.
Try Session
Available on iOS and Android. Seven-day free trial.